

Debugging RPGsp Applications
Debugging is the process of finding bugs by stepping through a running RPGsp application.
Method 1 (using the integrated debugger)
RPGsp includes an integrated debugger for RPGsp web applications and standard RPGLE programs. You can also debug modules that are bound to your programs. The debugger will allow you to step through running applications and evaluate variables from within the RPGsp IDE. You can even step backwards to evaluate variables at earlier stages of program execution.
Please note: RPGsp's integrated debugger is job-transparent, meaning that debug mode will activate for any running instance of the program. For this reason it's recommended to use the debugger only in a test environment, or when you are sure that no one will be running the application.
Getting Started
Before you can use the integrated debugger, you will need to compile your application for visual debugging. To do this, select Compile for Visual Debugging under the Debug menu.
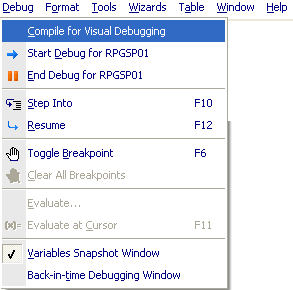
Once this is done, you can start the debugger by selecting Start Debug under the Debug menu. When you launch your application, the debugger will pause execution and you can step through the program and evaluate variables while it's running.
Stepping Through the Application
While debugging a running application, the next line of code to be executed is highlighted in blue.
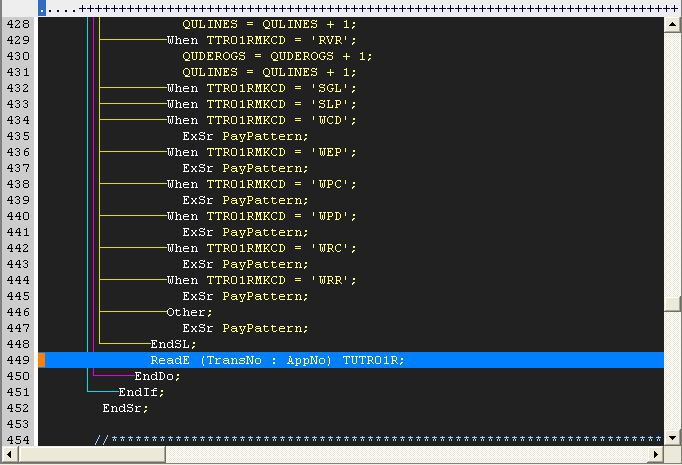
To step one line, press the F10 key, or select Debug -> Step Into. The current line of code will execute, and the debugger will move forward one instruction.
To
set a breakpoint, place the cursor on the desired line and press the F6 key,
or select Debug -> Toggle Breakpoint. A breakpoint is represented
in the editor by a red dot (![]() )
beside the line number. Breakpoints can be removed individually by pressing F6
again on a line that already contains a breakpoint. You can remove all breakpoints
in a program at once by selecting Debug -> Clear All Breakpoints.
)
beside the line number. Breakpoints can be removed individually by pressing F6
again on a line that already contains a breakpoint. You can remove all breakpoints
in a program at once by selecting Debug -> Clear All Breakpoints.
To run your application to the next breakpoint without stepping through each line, press the F12 key, or select Debug -> Resume.
Debugging Bound Modules
To debug a module that is bound to your program, you will first need to compile the module source for visual debugging by selecting Debug -> Compile as Module for Visual Debugging. After this is done, you'll also need to recompile the program or rebuild the service program that uses this module. Then set a breakpoint at the desired line in the module source. When a call to a bound procedure is made, you can switch the editor window to the module source and begin stepping through.
Evaluating Variables
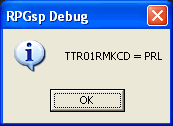
While stepping through a running application, you can check the current value of any variable, array, data structure, or database field. The quickest way to do this is to simply hover the mouse cursor over the desired variable in the editor. The current value will be displayed in a tooltip. You can also evaluate a variable by placing the cursor on the variable in the editor and pressing the F11 key or by selecting Debug -> Evaluate at Cursor.
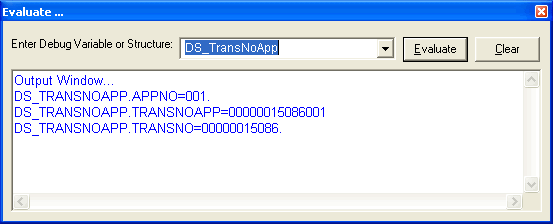
Another method of evaluating variables is to use the Evaluate Window. This window allows you to evaluate complex expressions. The evaluate window can display the entire contents of an array or data structure. It can even evaluate expressions with dynamic elements, such as MyArray(Index). To open the Evaluate Window, select Debug -> Evaluate.
The Variables Snapshot Window allows you to look at the values of all program variables in a convenient tree structure. To show the window, select Debug -> Variables Snapshot Window.
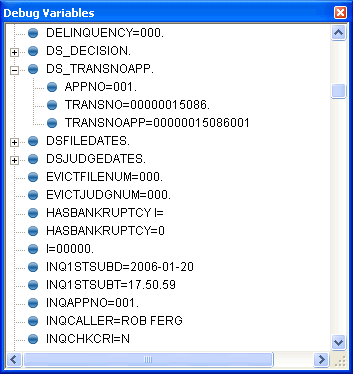
Arrays and data structures are listed as expandable items in the window. You can click the plus symbol to expand the item and view the value of each array element or data structure subfield.
The Variables Snapshot Window is updated with the new values each time you take a step through the source. The window can also be docked, if desired.
Using Back-In-Time Debugging
The Back-In-Time Debugging Window allows you to step backwards through a program to view the values of variables at earlier stages in the execution of the program. To display the Back-In-Time Debugging Window, select Debug -> Back-In-Time Debugging Window.
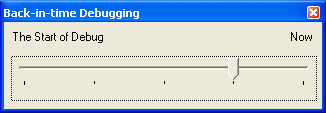
Each time you take a step through the program, a tick mark is added to the slider, and a history is kept of variable values at each step in the execution of the program.
When the window is first displayed, the slider is set to Now. At any point during debugging, you can move the slider back to one of the previous tick marks. The debug cursor in the editor will move back to the appropriate line, and the you can use any of the evaluation methods to see what the values of variables were during that point in the execution of the program.
Ending Your Debug Session
To end debug and and tell your program to resume running, select Debug -> End Debug. Your program will also run to completion if you step past the last line of code or if you use the Resume command with no more breakpoints in the program.
Please note: Always issue the End Debug command when you are finished debugging. You should also re-compile the program normally when finished debugging by using the appropriate option under the Build/Run menu.
Method
2 (debugging through a service job)
First, make sure to select the appropriate debugging view on the Compiler/LIBL Tab of the Options Dialog. Then recompile the page you would like to debug.

Please note: Unless you have configured RPGsp to save the intermediary RPGLE source during compilation, do not select *SOURCE for the debugging view. Instead, select *LIST.
You can override the default debugging view, by changing the DBGVIEW parameter under the Tools -> Compile Command Options menu.
Before you can debug (or step through) a running RPGsp application, you will need to determine which RPGSP web server job is processing the application's requests, so you can service that job. You can display all web server jobs with command WRKSBSJOB QHTTPSVR. The easiest way to determine the correct job is to open the debug1.rpgsp page from the C:\Program Files\RPGsp\Samples\ folder, then compile and launch it. Debug1 will determine the appropriate web server job and show you the STRSRVJOB command needed to start servicing the job. The command will look something like this:
STRSRVJOB JOB(010421/QTMHHTTP/RPGSP)
After executing the STRSRVJOB command, you will be ready to debug the application
using either IBM's STRDBG command or any third-party program debugging tool. Here
is an example of the STRDBG command:
STRDBG PGM(RPGSP/RPGSP01) UPDPROD(*YES)
Next, you will set program breakpoints, variable watches, etc. After that, simply launch the application from the RPGsp development environment.
As you are debugging the application, you will not see any HTML code, just the RPG. HTML code is not executed on the iSeries; it is simply rendered by the browser. Beware, your web server job may time-out if you take too long to debug the application. If this happens, simply restart Debug and launch the application again.
When you are done debugging, issue the following commands:
ENDDBG (ends debug)
ENDSRVJOB (ends service
job)
Method
3 (debugging interactively through the command line)
Another method is to debug the browser application using only the 5250 command line. You will first start your debug session:
STRDBG PGM(RPGSP/RPGSP01) UPDPROD(*YES)
After setting program breakpoints, simply call the browser application from the command line:
CALL RPGSP/RPGSP01
Substitute RPGSP01 with your Page (Program) Name.
When you are finished debugging, simply end debug with the ENDDBG command.
The disadvantage of
this method is that you will not be able to pass query string parameters or user
input to the application because you will not have access to the browser interface.
The advantage is that it is quicker and easier than the service job method.
Profound
Logic Software, Inc.
http://www.profoundlogic.com/
(937) 439-7925