
Debug Menu
Compile for Visual Debugging
Compiles the source into a program object that contains embedded debugging information for the RPGsp visual debugger. You will need to compile for visual debugging before you can use the visual debugger on your application.
Compile as Module for Visual Debugging
Compiles the source into a module that contains debugging information for the RPGsp visual debugger. You will need to compile for visual debugging before you can use the visual debugger on your module.
Start Debug
Starts debug and tells the program to stop and wait for debug instructions when it's run.
End Debug
Ends debug and tells the program to resume if it's still running. You should always give this command when finished debugging your application.
Step Into
Executes code one statement at a time. The editor will highlight the next instruction to be executed in blue. Shortcut: F10
Resume
Tells the debugger to allow the program to continue running. The program will run to the next breakpoint, or until completion if there are no more breakpoints. Shortcut: F12
Toggle Breakpoint
Places a breakpoint at the current line. If there is already a breakpoint on the line, the breakpoint is removed. Shortcut: F6
Clear All Breakpoints
Removes all breakpoints from the document.
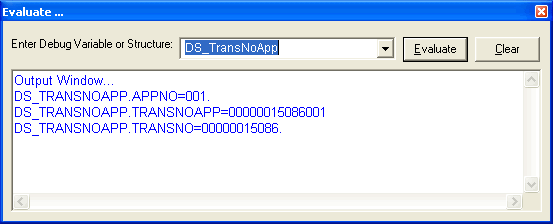
Evaluate
Opens the Evaluate Window where you can evaluate expressions while your program is running. The Evaluate Window can display the entire contents of an array or data structure. It can also handle complex expressions with dynamic elements such as MyArray(Index).

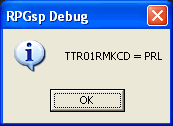
Evaluate at Cursor
Displays the value of a the variable at the cursor. Shortcut: F11

Variables Snapshot Window
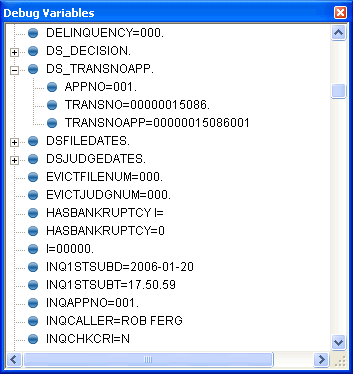
Opens the Variables Snapshot Window. The Variables Snapshot Window allows you to look at the values of all program variables in a convenient tree structure.

Arrays and data structures are listed as expandable items in the window. You can click the plus symbol to expand the item and view the value of each array element or data structure subfield.
The Variables Snapshot Window is updated with the new values each time you take a step through the source. The window can also be docked, if desired.
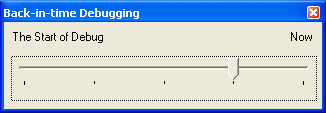
Back-in-Time Debugging Window
The Back-In-Time Debugging Window allows you to step backwards through a program to view the values of variables at earlier stages in the execution of the program.

Profound
Logic Software, Inc.
www.ProfoundLogic.com
(937) 439-7925